Custom activeadmin pages
Activeadmin is such a nice tool if you want a quick admin backend (who wants to write an admin backend right?), it has a pretty simple DSL and a very decent UI. It is also a very active project under constant improvement which always is a good thing. Let me show you how to create custom activeadmin pages with nice JS charts included.
I’m assuming that you have a rails application with activeadmin
installed. Let’s say that we have a User model and that we want to
display a nice chart showing how many users are premium (I know
that in real world apps you should use something much more robust,
but let’s keep it simple for now).
  # app/models/user.rb
  class User < ActiveRecord::Base
    # Your class accessors
    attr_accessible :is_premium

    # And a bunch of validations, methods, etc...
  end
Create the seed data
We will create a bunch of users so we can display some data in the admin:
  # db/seeds.rb
  (1..500).each do |cont|
    User.create(
      name: "User #{cont}",
      is_premium: [true, false].sample
    )
  end
Setup the JS charts library
For this example, we’re using flot charts but you can really use whatever you like. For this case I only need 2 files that will be placed in its own admin folder (that folder does not exist, so you should create it) like this:
  # Place the files in their directories...

  app/assets/javascripts/admin/flot/jquery.flot.js
  app/assets/javascripts/admin/flot/jquery.flot.pie.js
Now to load those files in the admin using the assets
pipeline, we need to add them to the active_admin.js.coffee file:
  # app/assets/javascripts/active_admin.js.coffee

  #= require active_admin/base
  #= require admin/flot/jquery.flot
  #= require admin/flot/jquery.flot.pie
Now our JS are being served using the rails assets pipeline (minified, concatenated, gzipped, etc). Remember that you can do that to include any JS file in the admin.
Get the data and display a custom partial
The first thing that we need to do is to display a custom page. In
activeadmin you can render partials containing any HTML that you
want, we’ll use erb in this example but it can be any of the supported
formats such as haml.
So, we create our partial view:
  # app/views/admin/user/_charts.html.erb
  <h1>Hello world!</h1>
And then in the admin controller:
  # app/admin/user.rb

  ActiveAdmin.register User do
    actions :all, only: [:index]

    index do
      render partial: 'charts'
    end
  end
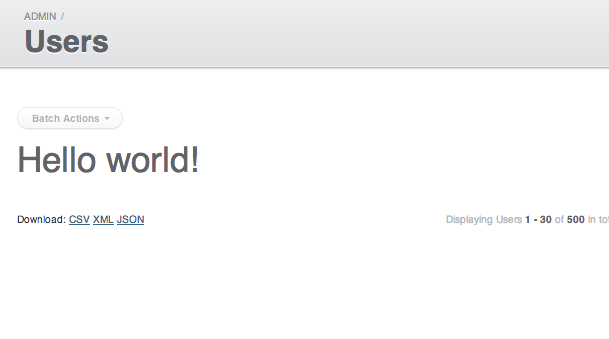
Now when you visit /admin/users you should see your partial template
being rendered:

Displaying the data in a chart
Now we just need to query the data and pass it as a local variable to the partial. Let’s begin with that:
  <!-- app/views/admin/users/_charts.html.erb -->
  <div style='float: left'>
    <h2>Premium users</h2>
    <div id="premium_users_pie"
         style='height: 400px; width: 400px'>
    <div>
  </div>

  <script type="text/javascript">
  $(document).ready(function(){
    var users = <%= raw users %>
    $.plot('#premium_users_pie', users, {
      series: { pie: { show: true } },
      legend: { show: false }
    });
  });
  </script>
Basically we’re setting our view up to display the JS chart, this step will vary depending on the charting library that you’re using.
The only thing that you need to remember is to output the users
variable in raw format, otherwise the JSON value will be escaped and
the chart won’t render (again this is because our charting library
requires JSON format, but this might not be your case).
Now let’s get that data and generate the JSON, to do that we need to modify the admin controller again:
  # app/admin/user.rb

  ActiveAdmin.register User do
    actions :all, only: [:index]

    index do
      premium_users = User.count(group: 'is_premium')
      json_data = []
      premium_users.each do |key, value|
        json_data << {
          label: key,
          data: value
        }
      end

      render partial: 'charts', locals: {
        users: json_data.to_json
      }
    end

  end
That’s it, we query the database so we can get the total users grouped
by the is_premium attribute and then we create a JSON response and
pass it to the partial. The JSON parsing part is needed because flot
needs that specific JSON format but once again, this might not be your case.
Now it’s time to check our admin again, let’s visit /admin/users in
our browser and we should see a nice pie chart with our data.

That’s it! Happy charting!